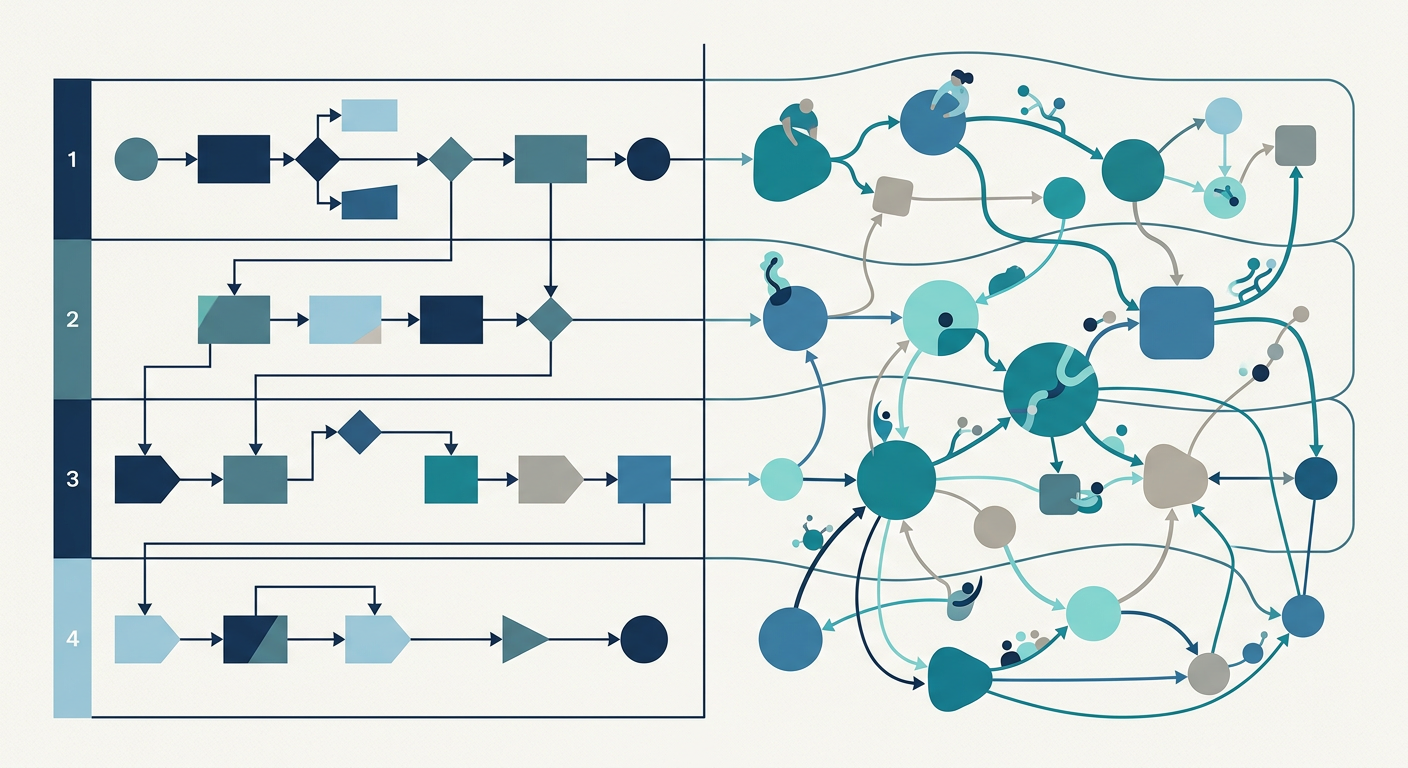
Lucidchart is a capable, well-designed diagramming tool — and that is exactly why this evaluation is worth doing carefully. The question is not whether it is good. The question is whether a diagram is the right artefact for the process work your operations team actually needs to do.
If you are an ops or transformation lead in Singapore or Malaysia, sitting on a library of swimlanes your team built over the past two years, this post gives you a straight answer. What Lucidchart does well. Where it structurally stops. And the distinction that determines whether your process documentation is an asset or an archive.
What Lucidchart Does Well
Start here, because this part matters.
Lucidchart has earned genuine adoption across enterprise teams, and the reasons are sound. Before any comparison, those reasons deserve a clear account.
Collaboration. Real-time multi-user editing means a team can build a process map together in a workshop without emailing files back and forth. Comments, threads, and revision markers keep the conversation inside the diagram. For alignment sessions, that is a real productivity gain.
Diagram fidelity. Lucidchart supports the full BPMN 2.0 symbol set — pools, lanes, gateways, intermediate events, tasks, subprocesses, boundary events. The notation is correct. The output is professional. Teams familiar with BPMN fundamentals will find the tool meets the standard without compromise.
Accessibility and ease of use. New users get productive quickly. The interface is familiar to anyone who has used a browser-based productivity tool. The learning curve is shallow. Drag-and-drop makes BPMN usable for people who have never formally studied process notation, which matters in a mid-market ops team where diagramming is one task among many.
Integration breadth. Lucidchart connects with the productivity platforms most teams already rely on — document storage, project management, communication tools. Diagrams live inside existing workflows rather than in a separate silo.
These are not concessions. They are the genuine reasons a well-run ops team might choose this tool for specific jobs. Keep them in mind as we go further.
The Category Error in the Evaluation
Here is where most evaluations go wrong.
The standard comparison puts Lucidchart against other diagramming tools and asks which one draws better BPMN. That is a useful question if your problem is diagram quality. It is the wrong question if your problem is process governance.
A more useful frame: you evaluated Lucidchart against process tools. That is like evaluating a slide deck against a ledger. Both contain financial information. One describes a position; the other records every transaction that produced it. You would not audit a company using slide decks alone, however well-designed they are.
A BPMN diagram is a description artefact. It records what someone believed the process was at the moment they drew it. It does not record what the process is doing now. It does not signal when the floor has drifted from the drawing. It does not know which steps are generating waste this quarter.
Lucidchart is excellent at drawing the process you describe. It is silent about the process you run.
That is not a failing specific to Lucidchart. It is the structural boundary of the diagramming category. The evaluation question most teams never ask is: given that boundary, is a diagram the primary artefact your process operations need?
The Swimlane That Time Forgot
Picture a transformation team at a mid-market bank. They spent 14 months documenting their key operational processes in a diagramming tool. BPMN-compliant swimlanes for onboarding, KYC, credit approvals, exception handling, and interbank transfers. The work was thorough. The diagrams looked good.
Two years later, the team has 400-plus files, three naming conventions, and a compliance audit incoming.
The auditor asks for the authoritative version of the KYC process. Three different people point to three different files. One is a document dated early 2023. Someone renamed it FINAL-v4 at an unspecified point. Another was shared by the team lead in a chat message marked "current" — a message nobody can locate now. A third version surfaced in a subfolder, slightly different from the other two, with no indication of which revision it reflects.
The revision history in the diagramming tool shows who moved which shape and when. It does not show whether the actual KYC process on the floor matched any of the three versions in March, when a regulatory update came through.
Ask your own team which diagram is authoritative. Count the different answers. That number tells you more about your process asset maturity than any feature comparison.
This scenario is illustrative — constructed from patterns common in mid-market ops environments, not drawn from a specific named client. But the dynamic it describes is not hypothetical. It is the standard outcome when description artefacts are used as governance records.
What a Process Asset Actually Requires
A process asset has properties that a diagram alone cannot provide. Three are non-negotiable.
An owner. Not the person who drew the diagram — the person who is formally accountable for the process outcome. Ownership means that when a regulatory change comes through, someone is responsible for reviewing, approving, and updating the documented version. Without assigned ownership, version drift is guaranteed.
A version tied to execution. A version number that refers to a diagram edit is not the same as a version number that refers to a process state. Version 3.1 of a process asset should mean "this is what the process looked like from 15 March to 8 June, as confirmed by execution data." Version 3.1 of a diagram means "someone made three changes after the second save."
A change signal. When observed execution on the floor diverges from the documented process, something must flag it. The flag triggers a review. Without a change signal, divergence accumulates invisibly until an audit, an exception, or an incident surfaces it.
These three properties define what the E-S-S-A-M Design phase produces. In ESSAM's framework, a diagram drawn in any tool becomes a process asset only when it passes through Design: owner assigned, execution validated, living version published. The BPMN drawing is input to Design. It is not the output.
Diagram vs. process asset: the three-column test
| Dimension | Diagram (e.g., Lucidchart) | Living Process Asset (ESSAM) |
|---|---|---|
| Source of truth | What someone drew and believed | What execution produced and confirmed |
| Change signal | None — someone must notice and rebook | Automatic — floor divergence flags a review |
| Owner | File owner (whoever last edited) | Process owner (accountable for outcomes) |
The Version History Diagramming Tools Do Not Have
Lucidchart logs who changed what and when. That is useful for diagram management. It does not answer the questions that matter for operational audit.
Process version history answers different questions:
- When did the approval step change from two reviewers to one?
- Which documented version was in effect when the exception cluster appeared in February?
- What did the pre-optimisation baseline look like compared with the post-Simplify state?
These questions require versioning against execution events, not against diagram edits. A before/after audit view — showing the process state at any point in the operational timeline — requires that your process documentation be tied to what actually happened on the floor, not to what someone redrew.
ESSAM's before/after audit view produces exactly that record. When a Kuwait bank used ESSAM's AI Lean Cycle on their procurement process, the before/after view showed precisely which steps existed before Eliminate and Simplify, what the documented state was after, and when the transition occurred. That audit trail made the improvement verifiable: the procurement cycle dropped from 139 days to 57, a 59% reduction, with 82 days of work retired before any automation was introduced. No diagrams were renamed FINAL-v4 during the process.
A diagramming tool cannot produce that kind of record. That is a structural boundary of the category, not a product deficiency.
The Honest Evaluation Scorecard
This is the information-gain section most evaluations omit. Use it to assess whether a diagramming tool is the right primary artefact for your process management need — and where the boundary of that category sits.
What Lucidchart does well
| Criterion | Assessment |
|---|---|
| BPMN 2.0 notation support | Full symbol set, correctly rendered |
| Real-time collaboration | Multi-user editing with comments and threads |
| Ease of adoption | Shallow learning curve; no diagramming expertise required |
| Diagram version history | Edit log by user and timestamp |
| Visual clarity of output | Professional-grade; presentation-ready |
| Integration with productivity tools | Broad; connects with common enterprise platforms |
| Accessibility of notation | BPMN usable for non-specialists |
What a diagramming tool structurally cannot do
| Criterion | Structural limit |
|---|---|
| Source of truth | Records what someone drew, not what execution produced |
| Change signal | No automatic flag when floor diverges from diagram |
| Owner model | File owner (who created or last edited), not process owner (accountable for outcomes) |
| Execution-validated versioning | Diagram edit history only; not tied to operational events |
| Compliance audit trail | Shows diagram history; does not show process history |
| Waste classification | No automatic tagging of which steps are Eliminate, Simplify, Automate, or Migrate candidates |
When a diagram is enough
Use a diagramming tool as your primary artefact when:
- You are documenting a process once, for a specific and bounded audience — a training document, a regulatory submission, an onboarding guide.
- The process is stable and infrequent. Changes are rare and simple enough to track manually.
- The goal is communication and alignment, not governance and audit.
- The audience needs to read a process, not govern one.
When you need a living process asset
Move beyond a diagram when:
- The process runs daily and is subject to regulatory change (MAS, BNM, and associated reporting requirements in SG and MY).
- Multiple teams reference the same process and need a single authoritative version at any point in time.
- You need an audit trail tied to execution — for internal governance, external audit, or pre-automation baseline validation.
- You are building toward automation and need a verified, waste-classified baseline before a single rule is written.
- Your team cannot answer "which version is current" without checking three folders.
For most operational processes in mid-market banks and financial institutions across Singapore and Malaysia, the second set of conditions applies. A diagramming tool is a useful starting point. It is not an adequate endpoint.
Where ESSAM Fits in This Picture
ESSAM does not eliminate the diagram. It gives the diagram somewhere to go.
In ESSAM's 7-step AI Lean Cycle, the Map step produces a BPMN-compatible process map from a single-session conversation — no diagramming expertise needed, no pre-structured template required. That map is the input to the Design phase.
In Design, every process step is automatically classified against the E-S-S-A-M framework: Eliminate, Simplify and Standardise, Automate, Migrate. The output is a process asset — owned, execution-validated, and published as a living work instruction with a version that means something. Living work instructions deploy directly to the teams who run the process, over WhatsApp, the channel SG and MY operational teams already use.
The diagram does not become the deliverable. The living work instruction is the deliverable. The diagram is evidence of the design thinking that produced it.
For ops and transformation leads managing process mapping across complex, regulated environments, that is the distinction that determines whether your documentation library governs your operations or merely describes them.
What to Do With Your Existing Diagram Library
If your team has 200 or 400 diagrams already, the answer is not to discard them. The answer is to triage them.
Prioritise by operational criticality. Which processes run daily and carry regulatory weight? Those need to graduate from diagrams to assets first. Assign owners. Validate each against what the floor actually does. Capture the gaps between documented and actual. Publish a living version with a clean version number and a defined review cycle.
Processes that are infrequent, stable, or purely for communication can remain as diagrams. Not every documented process needs to be a living asset. But every operational process that carries audit exposure, regulatory risk, or cross-team dependency almost certainly does.
The E-S-S-A-M Design phase is how that graduation happens. It takes what your team drew and turns it into something the floor can actually use — and something a compliance audit can actually trust.
Explore the features that make single-session capture and Design phase practical for mid-market ops teams managing multiple processes in parallel.
A Note on This Evaluation
Lucidchart is a well-made product. Its strengths are genuine, and they are the reason this comparison required specificity rather than generalisation. A vague dismissal of diagramming tools would not serve the ops leads who are making a real decision about real tooling budgets.
The argument here is not "Lucidchart is inadequate." The argument is that the diagramming category has a structural scope — and that scope does not include process governance, execution-validated versioning, or change signalling. Knowing where that boundary is helps you make a better decision about which tool does which job in your stack.
The Next Step
If your team has processes that should be assets — and most mid-market ops teams in Singapore and Malaysia do — ESSAM's single-session capture and Design phase is a direct path from diagram to living work instruction.
See what your current processes look like when they have an owner, a version tied to execution, and a change signal built in: apac.essam.ai